Strong US Growth Too Hot to Handle?

- US Q3 GDP growth was big a surprise to the market keeping up the pressure for higher rates
- FOMC is unlikely to raise rates this week but will likely express their intense vigilance
- In the equity market higher long-term yields will pressure growth sectors such as Tech
- The tech sector has long-term merits but valuations look 20-30% too high if 10-year yields remain at or above 5%.
Astute investors following the US economy would find the current trend of robust growth and persistent inflation concerning. That economic dynamic has had the Federal Reserve appear worried, too. As we approach this week's FOMC meeting, it's widely anticipated that the Fed will keep the interest rates unchanged. Nevertheless, we anticipate the accompanying statement to subtly acknowledge the enduring strength in economic growth and inflation evident from recent data points.
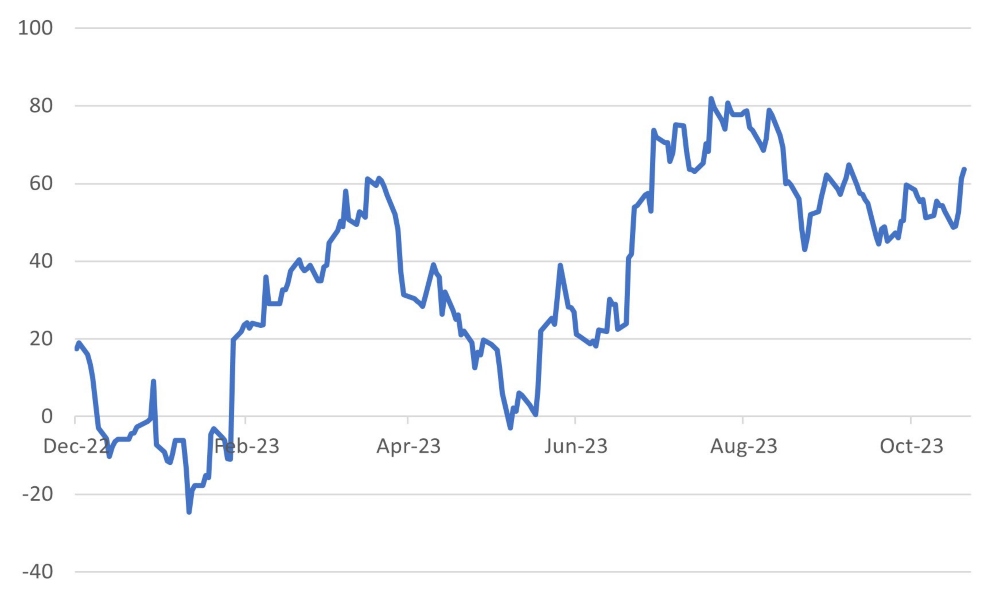
Chart 1: US economic surprise index on the rise
 Source: Bloomberg
Strong growth – stronger worries
Third-quarter U.S. GDP numbers surpassed expectations, registering an impressive 4.9% quarterly annualized growth rate, the strongest pace since 2021. Economists – caught somewhat off guard – are now scrambling to upwardly revise their fourth-quarter estimates, with projections expected to significantly outpace the current estimates of approximately 1.5%. This surge in the U.S. economic surprise index underscores the breadth and vigour of the current economic data. It is evident that the U.S. economy is operating at full throttle, marked by remarkably low unemployment levels. However, this level of growth also exacerbates the spectre of inflation. While the Federal Reserve may not make any rate adjustments this week, the possibility of a rate hike in the following meeting is certainly on the table.
While growth remains robust, the financial markets are grappling with concerns over its impact on global yields. Usually, strong U.S. GDP data is a cause for celebration in equity markets. However, the current sentiment among investors is that good news from the U.S. economy might spell trouble for asset prices. As a result, U.S. equities declined 2.5% over the past week, although bonds made modest gains. The yield on the U.S. 10-year Treasury note retreated by 8 basis points (bps), and global high-yield assets demonstrated stellar performance, delivering a remarkable 33 bps return on the week.
On the global stage, Asian and emerging market equities had a favourable week, driven in part by the growing confidence in the Chinese government's commitment to deploy an extensive set of measures to support the economy and local markets. The emerging markets also benefited from recent interest rate cuts initiated by the National Bank of Hungary and Chile's central bank. Brazil's central bank is also expected to reduce rates by 50 bps at this week's meeting. Given the likelihood that the ongoing trend of modest rate cuts will be maintained in the coming months and the potential for positive developments in China, we maintain a positive outlook on emerging market debt.
In summary, the U.S. economy's remarkable resilience, coupled with persistent inflation concerns, is shaping the investment landscape. The Federal Reserve, while not likely to act immediately, faces growing pressure to address inflationary pressures in the near future. In this environment, investors should remain vigilant and adaptable, carefully assessing opportunities and risks as they navigate the evolving market conditions.
Tech’s challenges
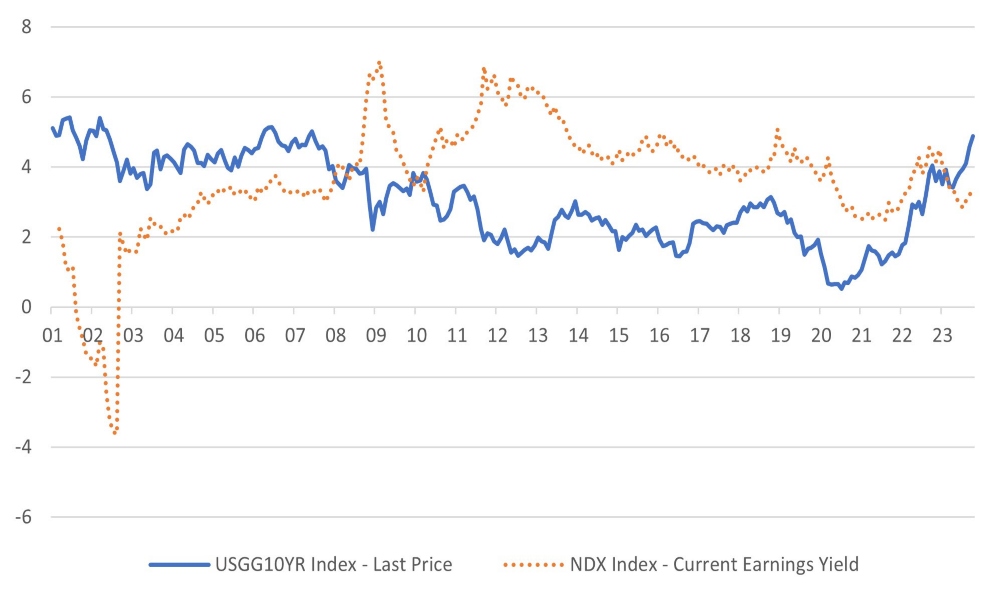
The rise in the US 10-year government bond yield in recent months is throwing up a significant challenge to the equity markets, with the NASDAQ index increasingly facing the heat. When the 10-year government bond yields began to rise initially, the index marched on, performing well in absolute terms. However, as the 10-year yield has approached 5%, the tech-heavy index has found market conditions much more challenging to negotiate. The earnings yield of the index, the inverse of the P/E, has started to rise again implying a so far modest derating of the tech sector.
Chart 2: Rising US 10-year yield an increasing challenge for the tech sector (NASDAQ 100)
 Source: Bloomberg
Reflecting on the financial markets’ performance over the past three decades, it's a challenge to identify macroeconomic conditions that precisely align with the current landscape. The astonishing surge in the U.S. 10-year yield – from 0.5% in July 2020 to nearly 5% today – stands out as an anomaly in the historical context. This anomaly – and what else can it be – may explain why, to date, the remarkable jump in yields has not triggered a substantial underperformance in growth sectors, particularly technology. It could well be that investors still remain aligned to the belief that the U.S. 10-year yield will inevitably retreat from these unprecedented levels.
Nevertheless, even if we assume that a 5% U.S. 10-year yield is an exceptional scenario, it's a challenge to see yields retreating to the historically typical range of 0-2% anytime soon. A more plausible range of 2-3% would correspond to an earnings yield of 4-5% and a target price-to-earnings (P/E) multiple range of 20-25x. The current P/E multiple of the NASDAQ 100 stands at 30x, though it is anticipated to drop to 25x on a forecast basis. In either scenario, we find ourselves at or above the upper end of the target valuation range.
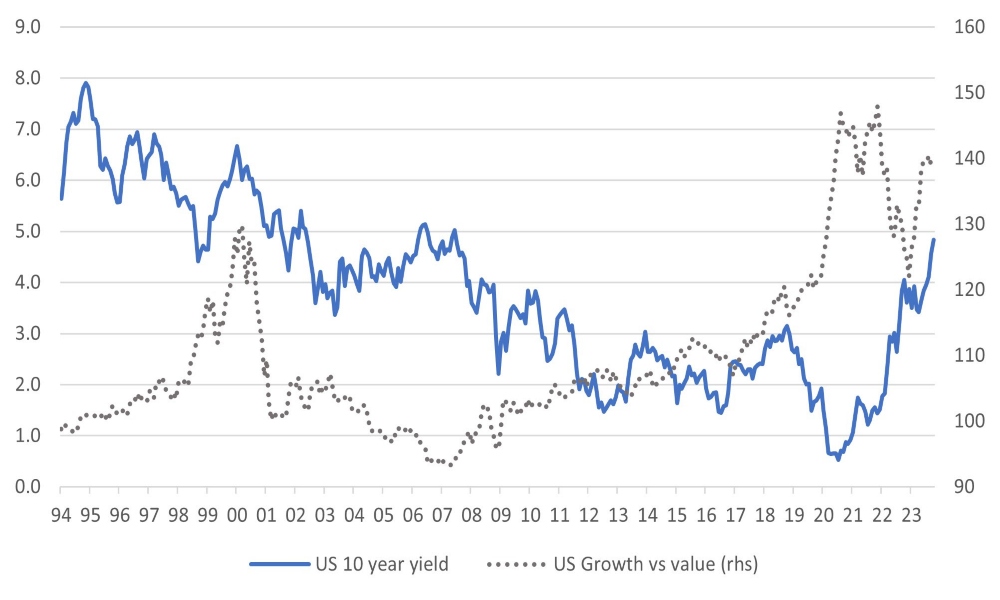
Drawing from the experiences of the years 2000 and 2007, we've observed that growth sectors, including technology, can sustain their performance in the face of rising long-term interest rates. Notably, the U.S. 10-year yield surged 250 bps between 1998 and 2000 before the relative performance of the U.S. growth sector index began to decline. In the current episode of rising yields, we witnessed a substantial underperformance in 2022, which has, to a significant extent, been reversed in 2023.
Chart 3: The relative performance of US growth index versus the market and US 10-year
 Source: Bloomberg
During the past few months, the financial markets were still working off the past 30 years' oft-repeated script. Trouble, whether in the markets or in the economy, brought an immediate easing off the brake pedal by the Fed. However, the past few weeks have seen a reassessment of those views. The more the markets believe that the Fed’s actions of the past are not the template for today (or the future), the more the market participants will have to discount weak growth and trouble for financial assets. It is also worth observing that US monetary conditions have already eased with lower real rates (as inflation has fallen back) and the dollar's lower value.
Today's economic conditions are quite different from the past thirty years. Therefore, there needs to be a more sceptical read-through of the Fed’s past actions in similar macro and market conditions. As was evident last year, even a significant setback in financial markets will not necessarily prompt a substantial drop in inflation, let alone result in a severe risk of deflation.
Forecasts for 2023 NASDAQ earnings are up 10% but the index is still up 25%!
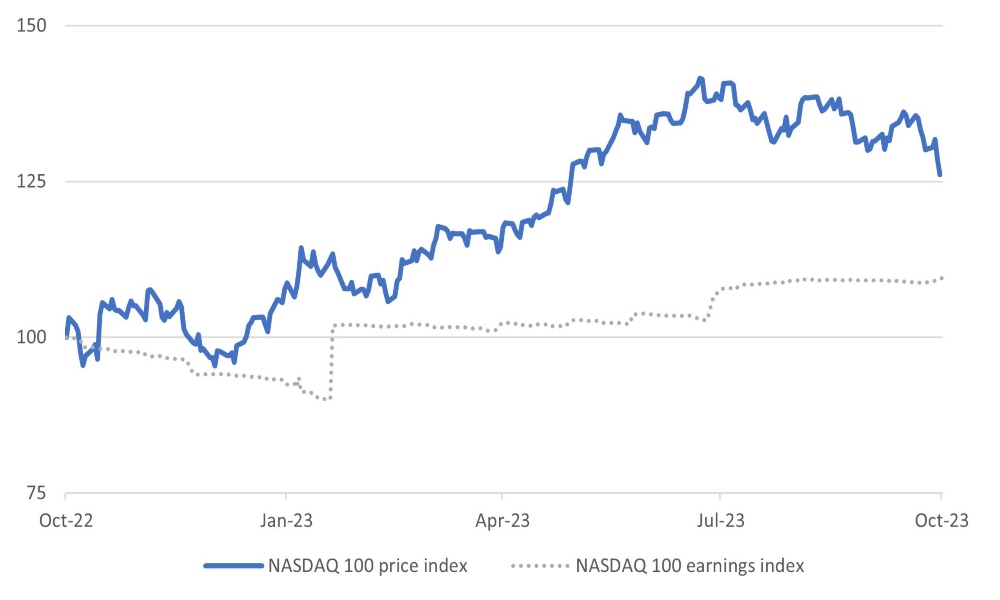
There are already more conventional reasons than those discussed above to be concerned about the performance of the tech sector. As Chart 2 shows, over the past year, the NASDAQ price index has outpaced the increase in the expected earnings of the index. While the index is up around 25% during this period, 2023 earnings forecasts are up only 10%. The implied re-rating of the sector looks unwarranted given the backdrop of the sharp rise in long-term bond yields.
Chart 4: NASDAQ price index has outpaced earnings revisions
 Source: Bloomberg and GCIO estimates
Leading constituents of the NASDAQ index have had widely diverging performance over the past year. At least part the reason for the gap between earnings revisions and the share prices has been the significant outperformance of stocks such as NVIDIA and Meta. However, of late, both stocks have lost momentum.
Table 1: Leading NASDAQ stock performances
| 3mth chg in eps* | PE ratio | 1yr change in price | |
| Microsoft Corp | 3.7 | 28.9 | 44.6 |
| Netflix Inc | -0.5 | 27.3 | 35.9 |
| Meta Platforms Inc | 4.1 | 16.6 | 194.4 |
| Alphabet Inc | 0.6 | 17.5 | 32.6 |
| Apple Inc | 0.7 | 26.1 | 15.3 |
| Amazon.com Inc | 5.5 | 29.2 | 7.8 |
| NVIDIA Corp | 48.0 | 26.7 | 206.1 |
| Tesla Inc | -15.9 | 55.6 | -8.6 |
| Broadcom Inc | 0.6 | 18.5 | 81.5 |
Source: Bloomberg
* three-month change in consensus forecasts for current-year earnings
Chart 5: Recent stars of the index – NVIDIA and Meta – share prices have gone sidewards
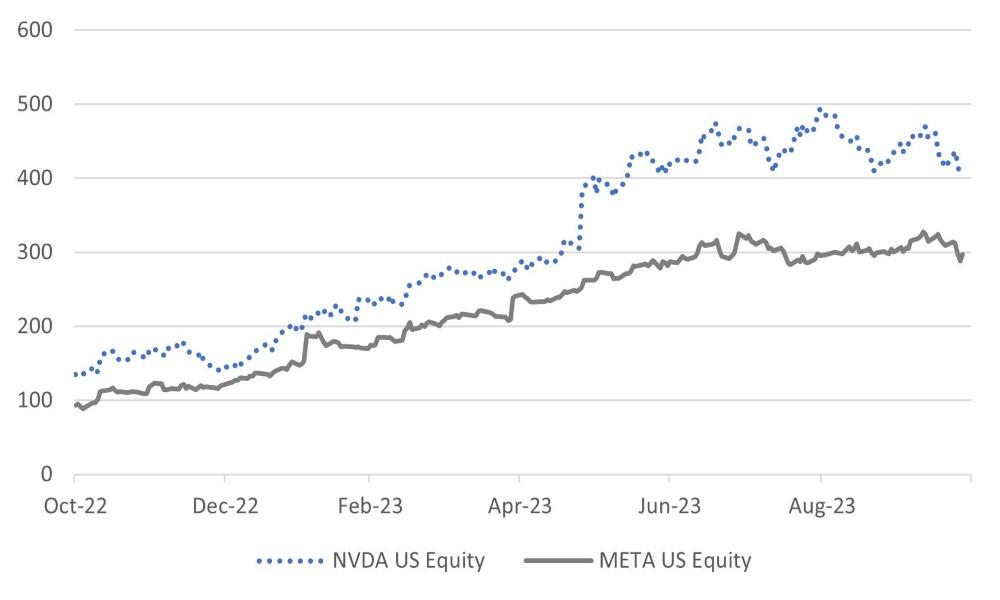
Source: Bloomberg
In summary, the current financial landscape is characterized by unique circumstances, with soaring U.S. 10-year yields challenging historical norms. Investors appear to be banking on a yield retreat, but even under such an assumption, valuations in growth sectors remain stretched.
Copyright © The Global CIO Office All rights reserved.
This document is being provided for information purposes only and on the basis that you make your own investment decisions; no action is being solicited by presenting the information contained herein. The information presented herein does not take account of your particular investment objectives or financial situation and does not constitute (and should not be construed as) a personal recommendation to buy, sell or otherwise participate in any particular investment or transaction. Nothing herein constitutes (or should be construed as) a solicitation of an offer to buy or offer, or recommendation, to acquire or dispose of any security, commodity, or investment or to engage in any other transaction, nor investment, legal, tax or accounting advice.
The information contained herein is not directed at (nor intended for distribution to or use by) any person in any jurisdiction where it is or would be contrary to applicable law or jurisdiction to access (or be distributed) and/or use such information, including (without limitation) Retail Clients (as defined in the rulebook issued from time to time by the Dubai Financial Services Authority). This document has not been reviewed or approved by any regulatory authority (including, without limitation, the Dubai Financial Services Authority) nor has any such authority passed upon or endorsed the accuracy or adequacy of this document or the merits of any investment described herein and accordingly takes no responsibility therefor.
No representation or warranty, express or implied, is made by Dalma Capital Management Limited (“Dalma”) or its affiliates as to the accuracy, completeness or fairness of the information and opinions contained in this document. Third party sources referenced are believed to be reliable but the accuracy or completeness of such information cannot be guaranteed. Neither Dalma nor any of its affiliates undertakes any obligation to update any statement herein, whether as a result of new information, future developments or otherwise.
This document contains forward-looking statements. Forward-looking statements are neither historical facts nor assurances of future performance. Instead, they are based only on current beliefs, expectations and assumptions regarding the future of the relevant business, future plans and strategies, projections, anticipated events and trends, the economy and other future conditions. Because forward-looking statements relate to the future, they are subject to inherent uncertainties, risks and changes in circumstances that are difficult to predict and many of which are outside of Dalma’s and/or its affiliates’ control. Actual results and financial conditions may differ materially from those indicated in the forward- looking statements. Forecasts are based on complex calculations and formulas that contain substantial subjectivity and no express or implied prediction made should be interpreted as investment advice. There can be no assurance that market conditions will perform according to any forecast or that any investment will achieve its objectives or that investors will receive a return of their capital. The projections or other forward-looking information regarding the likelihood of various investment outcomes are hypothetical in nature, do not reflect actual investment results and are not guarantees of future investment results. Past performance is not indicative of future results and nothing herein should be deemed a prediction or projection of future outcomes. Some forward looking statements and assumptions are based on analysis of data prepared by third party reports, which should be analysed on their own merits. Investments in opportunities such as those described herein entail significant risks and are suitable only to certain investors as part of an overall diversified investment strategy and only for investors who are able to withstand a total loss of investment.